
BI Dashboards in Melbourne & Worldwide
Understanding Results Requires More Than Historical Data
A monthly report can show that sales dropped, but rarely explains which product, which region, or which change caused it. Leadership may need to make decisions without sufficient insight into the underlying factors. A BI dashboard lets you analyse data at multiple levels, from the total down to the exact product or campaign behind the change, so decisions are based on underlying business data, not assumptions.
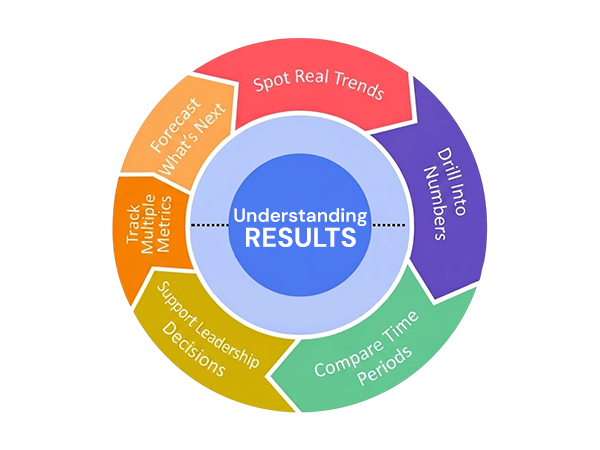
Spot Real Trends
See patterns across months, not single snapshots
Drill Into Numbers
Analyse totals down to the contributing factors
Compare Time Periods
See performance against last month or year
Support Leadership Decisions
Give the board data-driven insights
Track Multiple Metrics
See how different numbers move together
Forecast What’s Next
Project trends forward from real historical data
Business Intelligence Dashboards Focus On Trends And Analysis
An operational dashboard answers “what needs doing today.” A BI dashboard answers a different question entirely: “How is performance changing over time, and what factors are contributing to those changes?” Arrowbyte builds BI dashboards that show trends, comparisons and contributing factors together, so leadership decisions are based on evidence. If your reporting identifies outcomes without explaining the contributing factors, contact our team for a free BI dashboard consultation.

Data Without Context Can Lead To Incorrect Conclusions
A number on its own provides limited value without something to compare it against. A sales dip that appears significant when viewed in isolation may be consistent with historical seasonal performance once compared against the same month last year.
- Numbers without comparison mislead decision makers.
- Isolated metrics can obscure contributing factors.
- Manual trend analysis takes hours every month.
- Inconsistent reporting periods confuse comparisons
Developing BI Dashboards For Leadership With Arrowbyte
- Always show numbers next to a relevant comparison point
- Let users analyse information from summary metrics down to detailed records
- Build for the questions leadership actually asks in meetings
- Keep historical data accessible, not just the current period
- Highlight significant changes automatically, instead of requiring manual review
- Review report usage regularly and remove reports that no longer provide business value.
Services
+61 491 979 548